


I remember the exact moment the frustration boiled over. It was late on a Tuesday night, well past when I usually wrapped up work, and I was staring at my network activity monitor, a basic tool built into my router’s firmware. It showed a consistent, low-level upload stream, about 200-300 KB/s, emanating from my main workstation. The problem? I wasn’t actively syncing anything, nor was I running any obvious cloud backups. My file transfers were complete, my video calls long over. It was just… there. A phantom drain, a silent whisper of data leaving my machine, and I had absolutely no idea which application was responsible, or more importantly, where it was going.
As a freelance web developer and consultant, I handle a fair amount of sensitive client data. Project files, database credentials, API keys – the works. While I pride myself on robust security practices, including strong passwords, two-factor authentication, and encrypted storage, this kind of invisible network activity always gnawed at me. My existing toolkit felt woefully inadequate. Windows Task Manager offers a glimpse into network usage per app, but it’s a high-level overview. It tells you that an app is using the network, but not where it’s connecting, what port it’s using, or how long that connection has been active. The built-in Windows Firewall is a blunt instrument, allowing me to block an entire application from accessing the internet, but it doesn’t offer any real-time visibility or granular control over specific connections or destinations.
I’d tried to get more detail in the past. I’d spent hours wrestling with `netstat -ano` commands in the command prompt, attempting to correlate obscure process IDs with open connections. This was like trying to read a novel by looking at individual letters scattered across a table – technically possible, but incredibly inefficient and prone to errors. Then there was Wireshark. A powerful tool, no doubt, and invaluable for deep packet inspection, but it was overkill for my everyday needs. Setting up capture filters, sifting through thousands of packets, understanding TCP/IP headers – it felt like getting a PhD in network forensics just to answer a simple question: “What is my browser doing right now, and where is it sending data?” It was a reactive tool, not a proactive monitor, and certainly not something I could leave running in the background for quick insights without generating terabytes of log files. I simply didn’t have the time or the specialized knowledge to effectively use it for constant vigilance. My evenings were increasingly consumed by this low-level anxiety, a feeling that my digital fortress had a tiny, invisible back door. The breaking point was realizing I was spending nearly an hour every few days just trying to manually trace these ghost connections, time I could have been spending on actual client work or, frankly, getting some much-needed sleep.
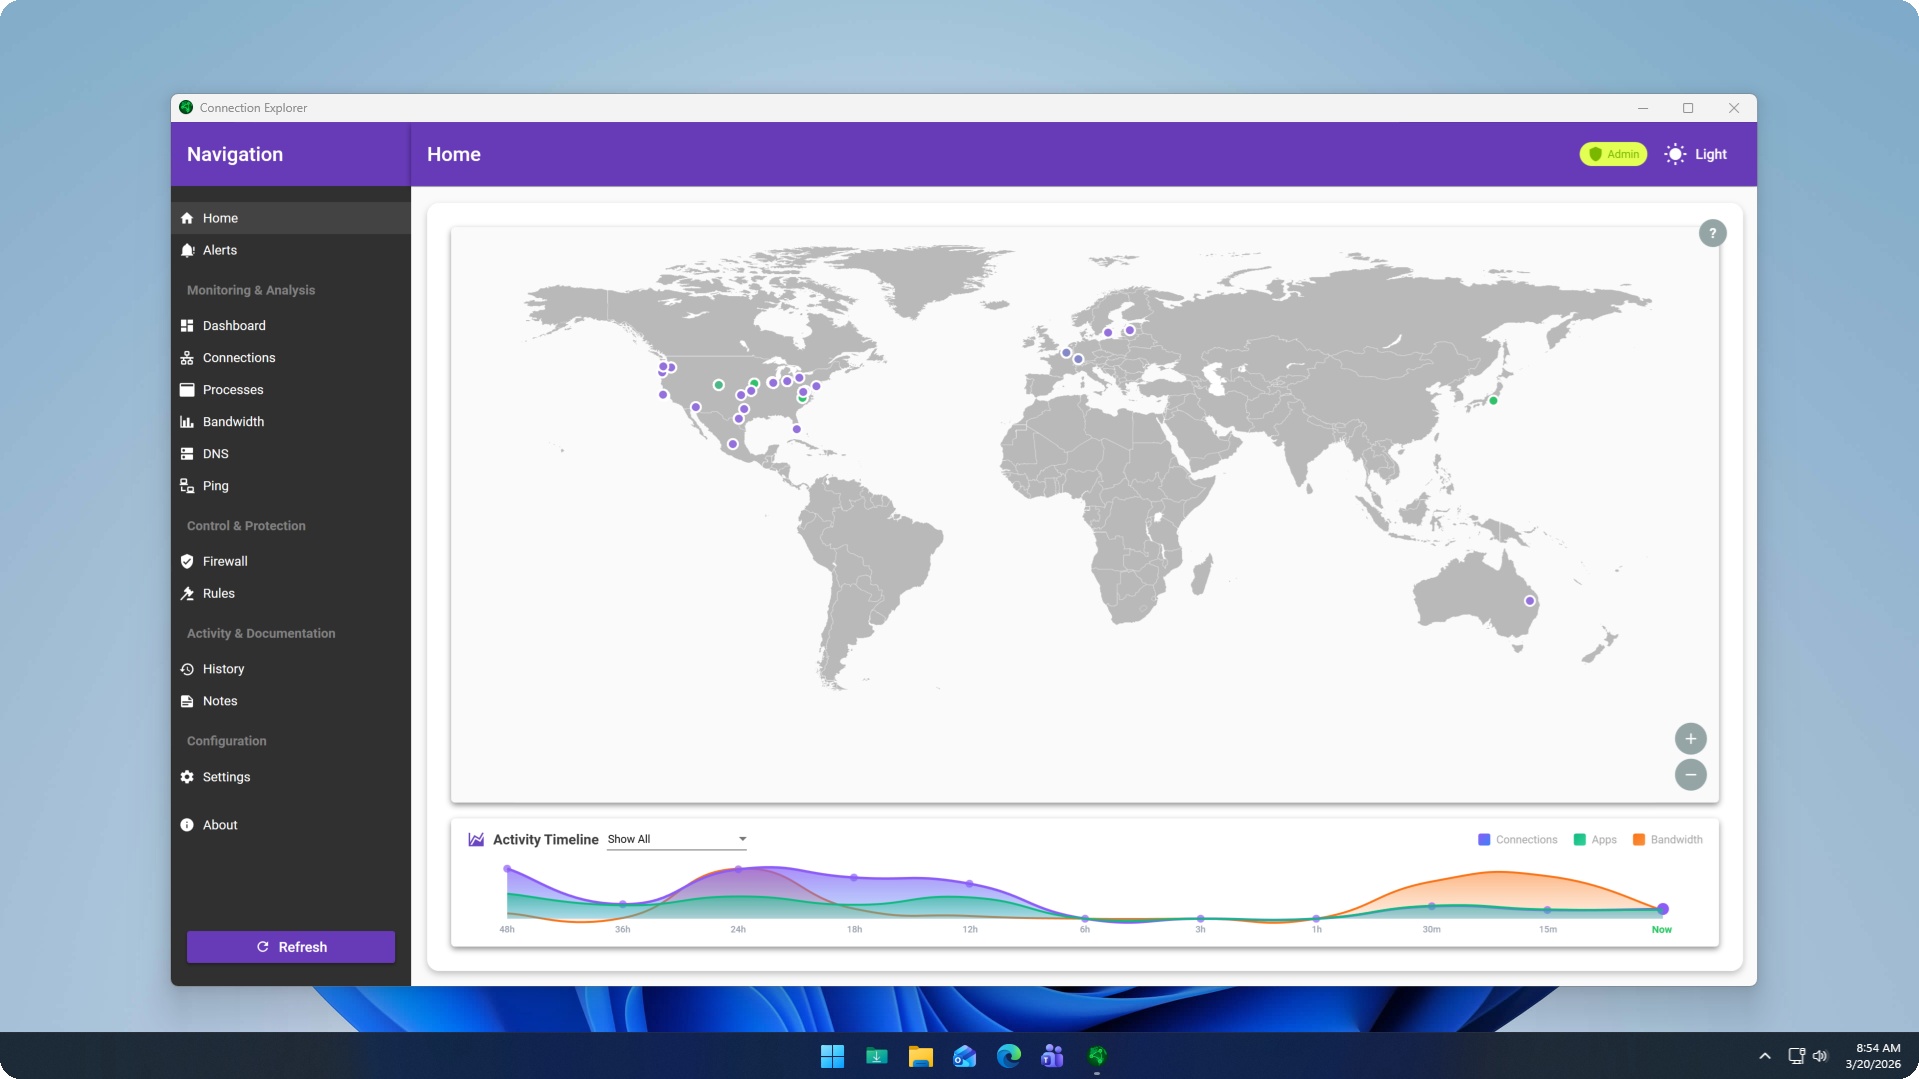
The search for a better way began in earnest that very night. I dove into obscure tech forums and Reddit threads, typing desperate queries like “real-time network monitor per application” and “see where my apps connect.” I was looking for something that struck a balance between the overwhelming complexity of Wireshark and the utter lack of detail from my router logs. That’s when I stumbled upon Stardock’s Connection Explorer. The name itself was appealing; it promised to let me explore my connections, not just list them. The landing page was clean and professional, which immediately instilled a sense of trust. It wasn’t flashy or over-promising with buzzwords, but rather focused on clear benefits: “See Every Connection,” “Your apps are talking, see who’s listening.” It highlighted features like an interactive map, smart alerts, and easy blocking of problematic processes. The visual nature of the solution, particularly the map showing geographical locations of connections, caught my eye. It looked like a legitimate, user-friendly tool from a reputable developer, not some fly-by-night freeware with questionable origins. The promise of “easy to see and understand” complex data was exactly what I needed. I didn’t need to be a network engineer; I just needed a clear picture. The frustration of that phantom upload stream, combined with the credibility of the Stardock name, was enough to convince me to give it a try. I downloaded it right away, hoping it would be the answer to my ongoing network visibility woes.
The onboarding experience was surprisingly smooth. The installation was a standard Windows affair, clicking through a few prompts, and it launched almost immediately. There wasn’t a lengthy setup wizard or a need to configure complex network adapters. It just… started working. Within seconds, the main dashboard populated with a live feed of connections. My initial reaction was a mix of awe and slight alarm. A globe-like map dominated the center, with lines radiating out from my location to various points across the world. Each line represented an active connection, and clicking on any of them revealed a wealth of detail: the application making the connection, the process ID, the remote IP address, the port, the protocol, and even the DNS name. It was all there, laid out in an intuitive, clickable interface. This was a far cry from the cryptic output of `netstat`.
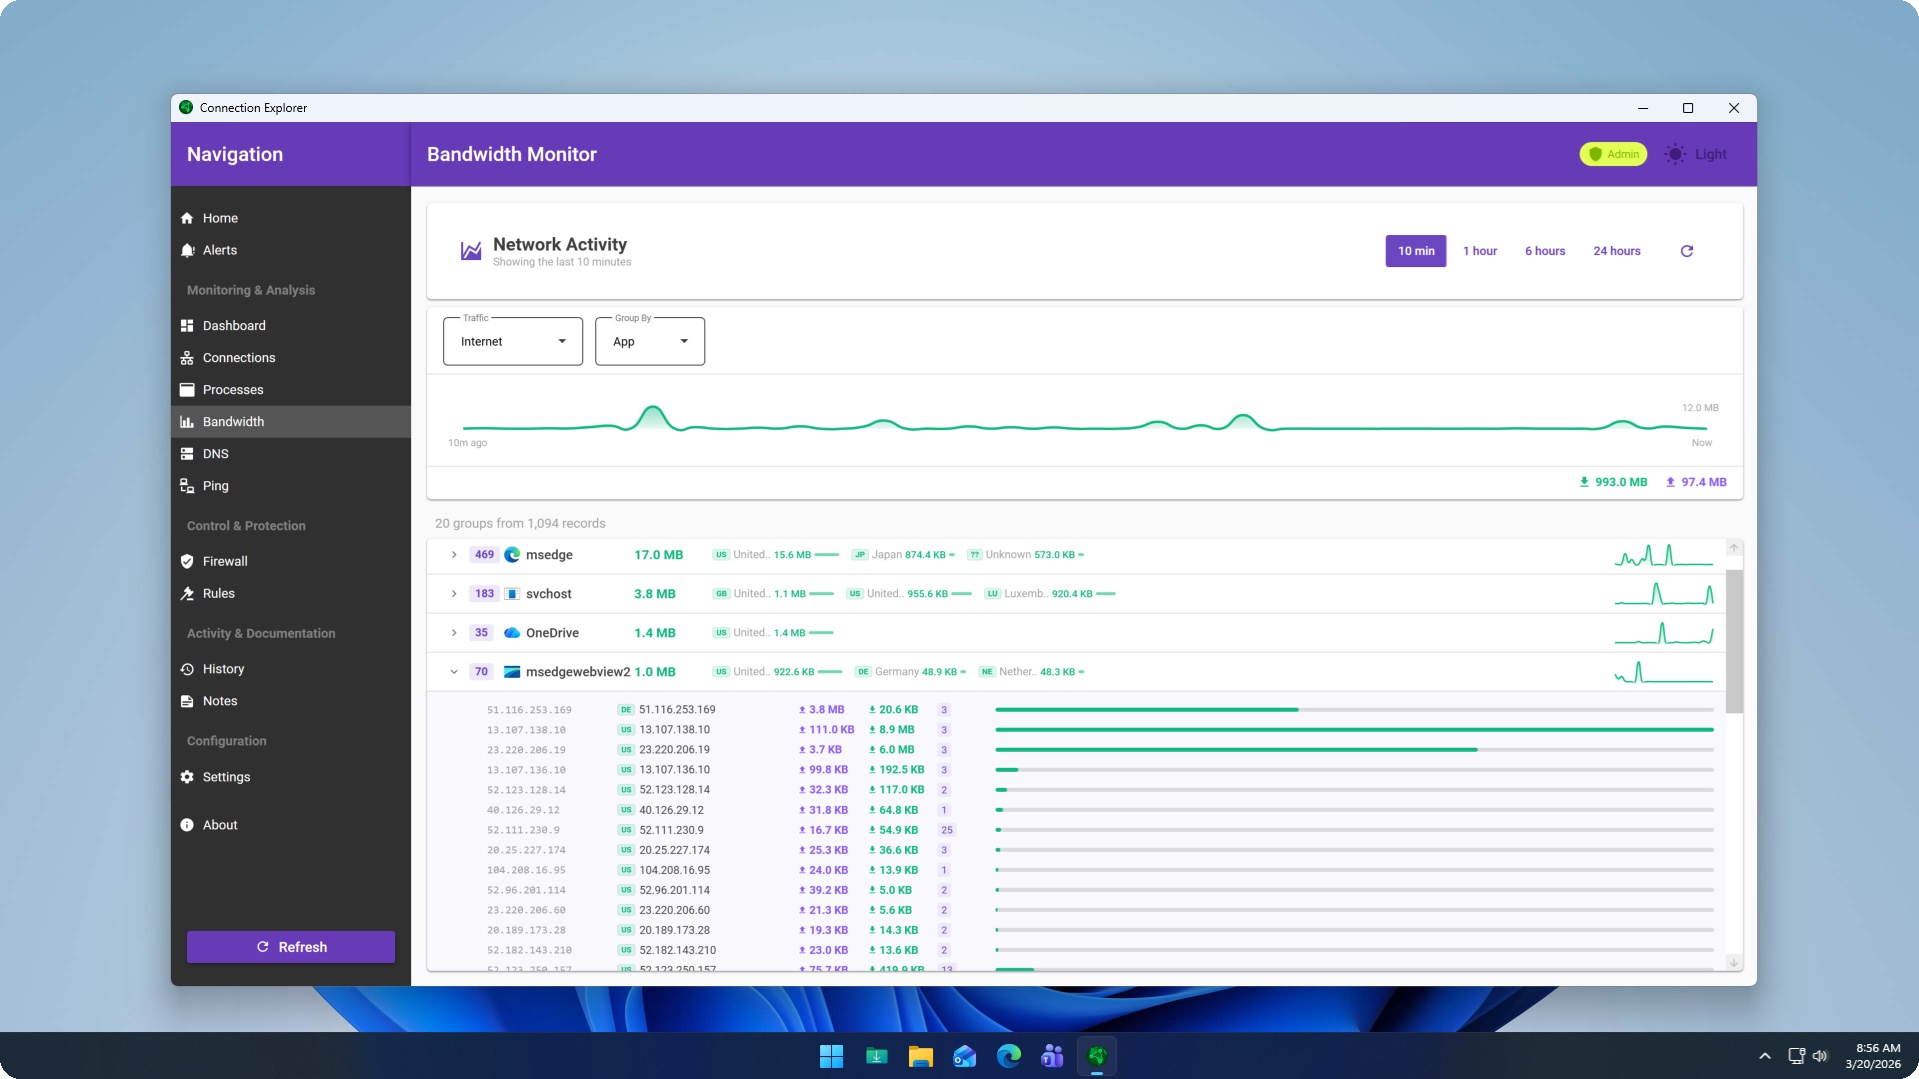
My first real output from Connection Explorer was an immediate eye-opener. I immediately scrolled through the list of active applications and their connections. There it was: the culprit of my late-night anxiety. A seemingly innocuous utility I had installed weeks ago, one I rarely used, was consistently initiating connections to a server in Eastern Europe. The application itself was for a niche development task, and I had no reason to believe it needed to connect to that particular region, especially when idle. My honest reaction was a profound sense of relief, quickly followed by a healthy dose of suspicion. This wasn’t just a simple connection; it was persistent. I could see the upload and download bandwidth for that specific connection, confirming the low-level data drain I had observed. The tool also showed the full path to the executable, making it easy to confirm which program was responsible. This immediate, clear identification was a revelation. Before, I would have spent hours trying to pinpoint this, likely without ever getting this level of detail. The specific detail that truly surprised me was the ease with which I could right-click on that suspicious connection and choose “Block Process.” No messing with Windows Firewall rules, no searching for executable paths – just an instant, decisive action that cut off the unwanted communication. It was incredibly empowering to regain control so effortlessly.
In my daily workflow, Connection Explorer has become an invaluable diagnostic tool, though I don’t necessarily keep it running full-screen all the time. When I install a new application, especially one from a less-known developer, the first thing I do after launching it is to open Connection Explorer. I observe its initial network activity, checking to see if it’s making connections to expected servers or if it’s phoning home to suspicious locations. I’ve set up several smart alerts, which is where the tool truly shines for proactive monitoring. For instance, I have an alert configured to notify me anytime a connection is made from my machine to a server outside of North America or Western Europe, unless it’s a whitelisted IP or domain. This has caught several instances of applications trying to reach unexpected endpoints, sometimes legitimate CDN nodes, but sometimes genuinely questionable servers. It means I no longer have to constantly glance at a network graph; the alerts pop up, and I can investigate only when something unusual occurs. This has cut down my investigative time for suspicious activity from hours of manual digging to mere minutes of reviewing an alert and making a decision.
One specific task where it saves significant time is during client project handovers or when evaluating third-party tools. Often, clients will ask about the network footprint of a particular application or service I recommend. Before Connection Explorer, I’d have to provide vague answers or spend half a day setting up a test environment with Wireshark. Now, I can quickly demonstrate exactly what connections an application makes, where they go, and what ports they use. It’s a level of transparency that clients appreciate, and it builds trust. I can show them, for example, that a particular analytics script is connecting to a known analytics provider in the US, not some random server in an unexpected country. It’s also incredibly useful for monitoring my own IoT devices or smart home gadgets if I connect them to a PC, giving me a clear picture of their outbound communications, something often opaque with these devices.
However, Connection Explorer does have its limitations, and it’s important to be honest about them. While it excels at showing where data is going and which application is sending it, it doesn’t perform deep packet inspection. This means it won’t tell you the content of the data being sent. If I suspect a truly malicious payload is being transmitted, I’d still need to resort to more specialized tools like Wireshark, combined with traffic decryption techniques if the connection is encrypted. This is a significant distinction, as Connection Explorer is primarily a traffic visibility and control tool, not a full-fledged network intrusion detection system. Another minor quirk I’ve encountered is with certain VPN configurations. Sometimes, when my VPN client is actively routing all traffic, Connection Explorer might initially report connections originating from my local machine to the VPN server’s IP, which is technically correct but can obscure the ultimate destination until I look deeper into the connection details. It’s not a flaw, but it requires a slightly different interpretation of the initial visual data. Compared to my old process of fragmented tools and manual `netstat` commands, the difference is night and day. I’ve gone from a state of constant low-grade anxiety about my network activity to one of informed awareness. The time saved is easily several hours a week, which translates directly into more billable client work or, more importantly, a better work-life balance.
One thing that genuinely annoyed me, at least initially, was the sheer volume of legitimate connections that appear when you first start using the tool. It’s not a fault of the software, but more of a revelation about how chatty modern operating systems and applications are. Opening a browser tab, checking email, or even just having background services running can generate dozens, if not hundreds, of connections in a short period. This can make the map view look incredibly busy and sometimes challenging to parse without careful filtering. It took me a while to learn to filter out the noise and focus on the connections that truly mattered to my specific concerns. The rule-building interface, while powerful, also required a bit of experimentation to get right. Crafting a precise alert that triggers only on genuinely suspicious activity, rather than benign background processes, involved some trial and error, whitelisting known good IPs or domains. It’s a learning curve, but a necessary one to leverage the tool’s full potential.
Regarding the pricing, for what I get in terms of peace of mind and time saved, it feels justified. It’s a one-time purchase, not a subscription, which I appreciate. For a professional like myself, where network security and data privacy are directly tied to my reputation and client trust, it’s a necessary investment. The cost is negligible compared to the potential consequences of a data breach or unknowingly transmitting sensitive information. There are certainly cheaper, or even free, alternatives out there, but none offer the same combination of visual clarity, ease of use, and granular control that Connection Explorer provides. I still occasionally find myself doing things the old way, but only in very specific, niche circumstances. For instance, if I’m troubleshooting a highly technical network issue on a client’s server, where I need to analyze specific packet headers or reconstruct data streams, I’ll still fire up Wireshark. Connection Explorer isn’t designed for that level of forensic detail; it’s built for broad visibility and control over outbound connections from a user’s perspective. It’s about knowing who your apps are talking to, not deciphering the exact words of their conversation.
I’m actually considering setting up a more advanced rule for my development environment, specifically to monitor connections from my Docker containers. It’s a complex area, and I’m still figuring out how to best integrate that level of monitoring without generating too many false positives. But the fact that I even have the option to try and tackle that challenge with this tool speaks volumes about its capabilities.
